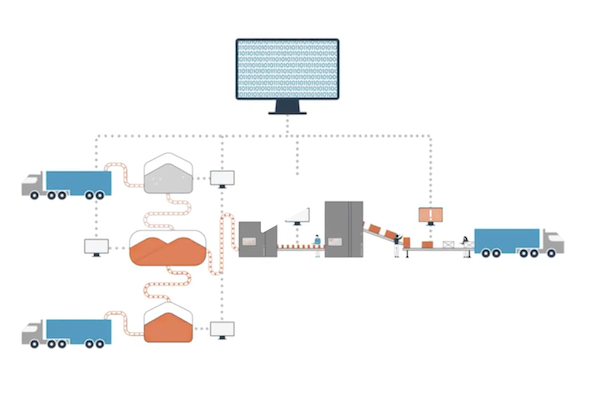
Remember MS-DOS computers? Show the C prompt to anyone born after 1990, and they’ll probably look at you like you’re wearing a tin foil hat. To execute the simplest of tasks on your computer, you had to know a whole language of commands. It was like asking “regular folk” to be Python coders just to binge cat memes — you know, basic computing tasks. Then one sunny day, Windows entered our lives. Files became visual. The desktop, file folders, the trash bin all became far more tangible with just a little visualization mixed into the operating system. Even though the underlying complexity still exists, the usability for everyday people was no small feat that paved the way to the digital revolution — and now Industry 4.0.
![]()
Read full post here →


